
Healthbridge Clinical Orientation
Healthbridge Clinical Orientation
What: A tour of the landing page you arrive on after logging in, the top navigation bar, the right-hand icon strip, and the panels available once a consultation is open.
Why: Knowing what each icon and zone does up front means less hunting around once you're mid-consult with a patient in front of you, and each zone below points to the full guide for that feature once you're ready to go deeper.
When: Worth a quick read before your first day using Healthbridge Clinical, or any time a colleague asks "what does that icon do?"
Landing page zones
1. The landing page
Location: After login
This is where you land after logging in. The Healthbridge Clinical logo and Home button (top-left) always bring you back here. Below the top bar, five tabs give you: 'My schedule' (your calendar), 'Condition tracker', 'Visit history', 'Pathology centre', and 'Document management'.
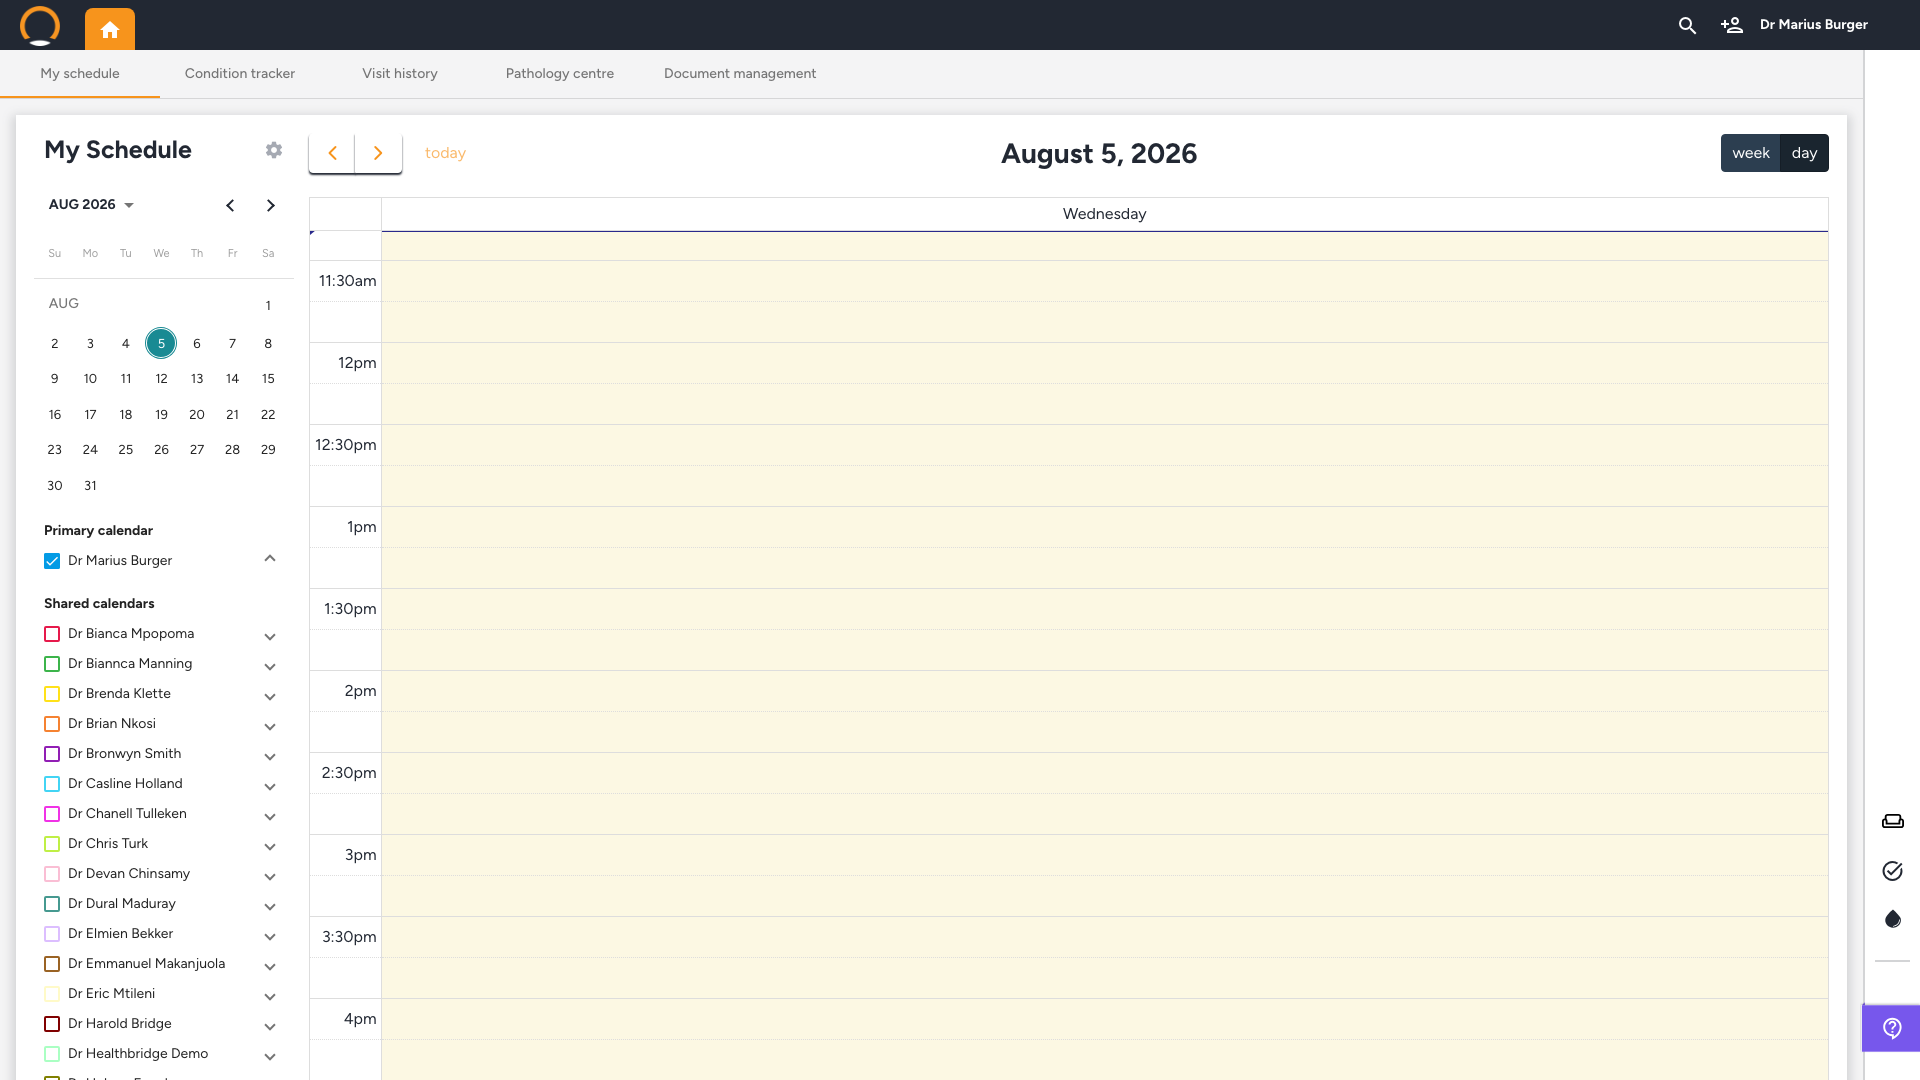
Go deeper: Condition tracker and Pathology centre each have a full guide of their own, covering filtering, follow-ups, and (for pathology) the AI Pathology Messenger.
2. Search for or add a patient
Location: Top navigation bar
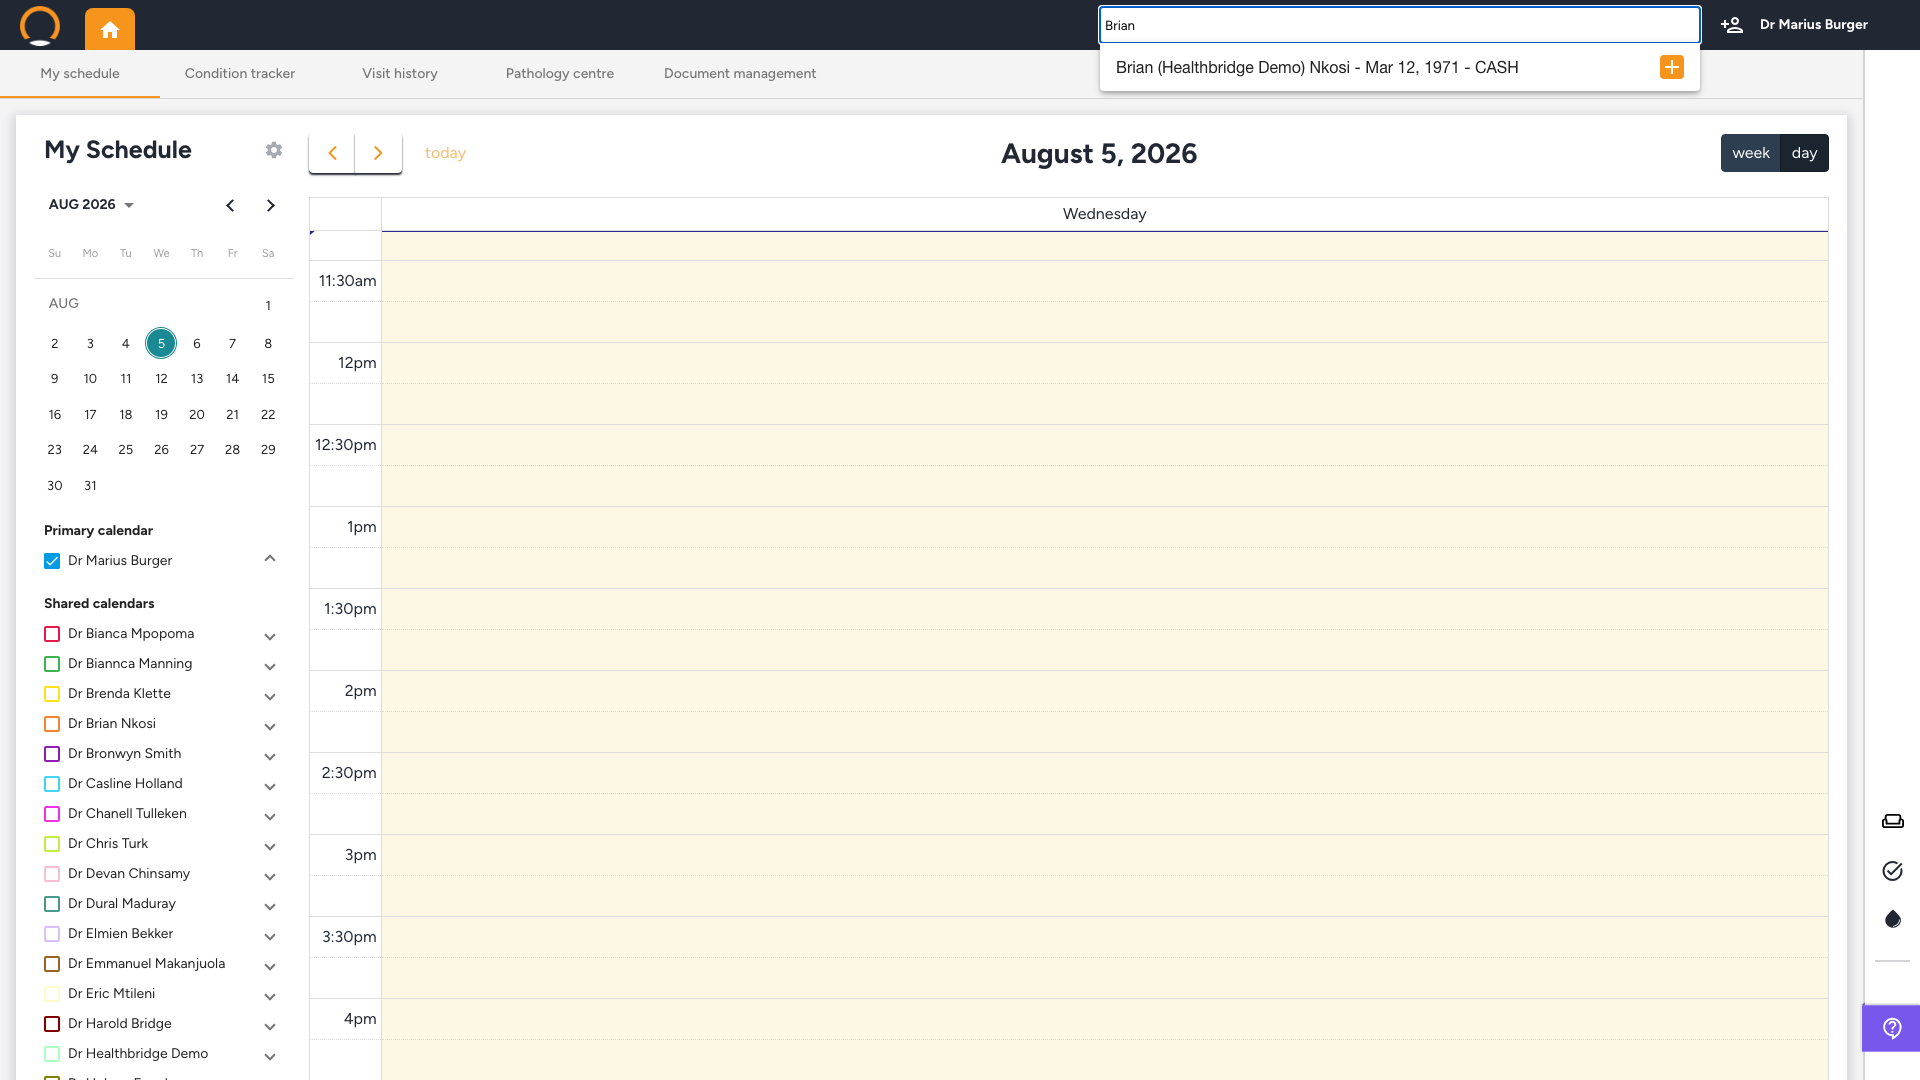
Click the Magnifying glass icon and type at least 3 characters to bring up matching patients. Click a name to open their file. Any patient file you have open stays visible as a tab next to the Home button, so you can jump back to it without searching again.
Next to it, the person-with-plus icon opens the form to register a brand new patient, for when someone visiting isn't in the system yet.
Go deeper: See How to Add a Patient to Healthbridge Clinical for the full new-patient form, field by field.
3. Waiting Room
Location: Right-hand icon strip
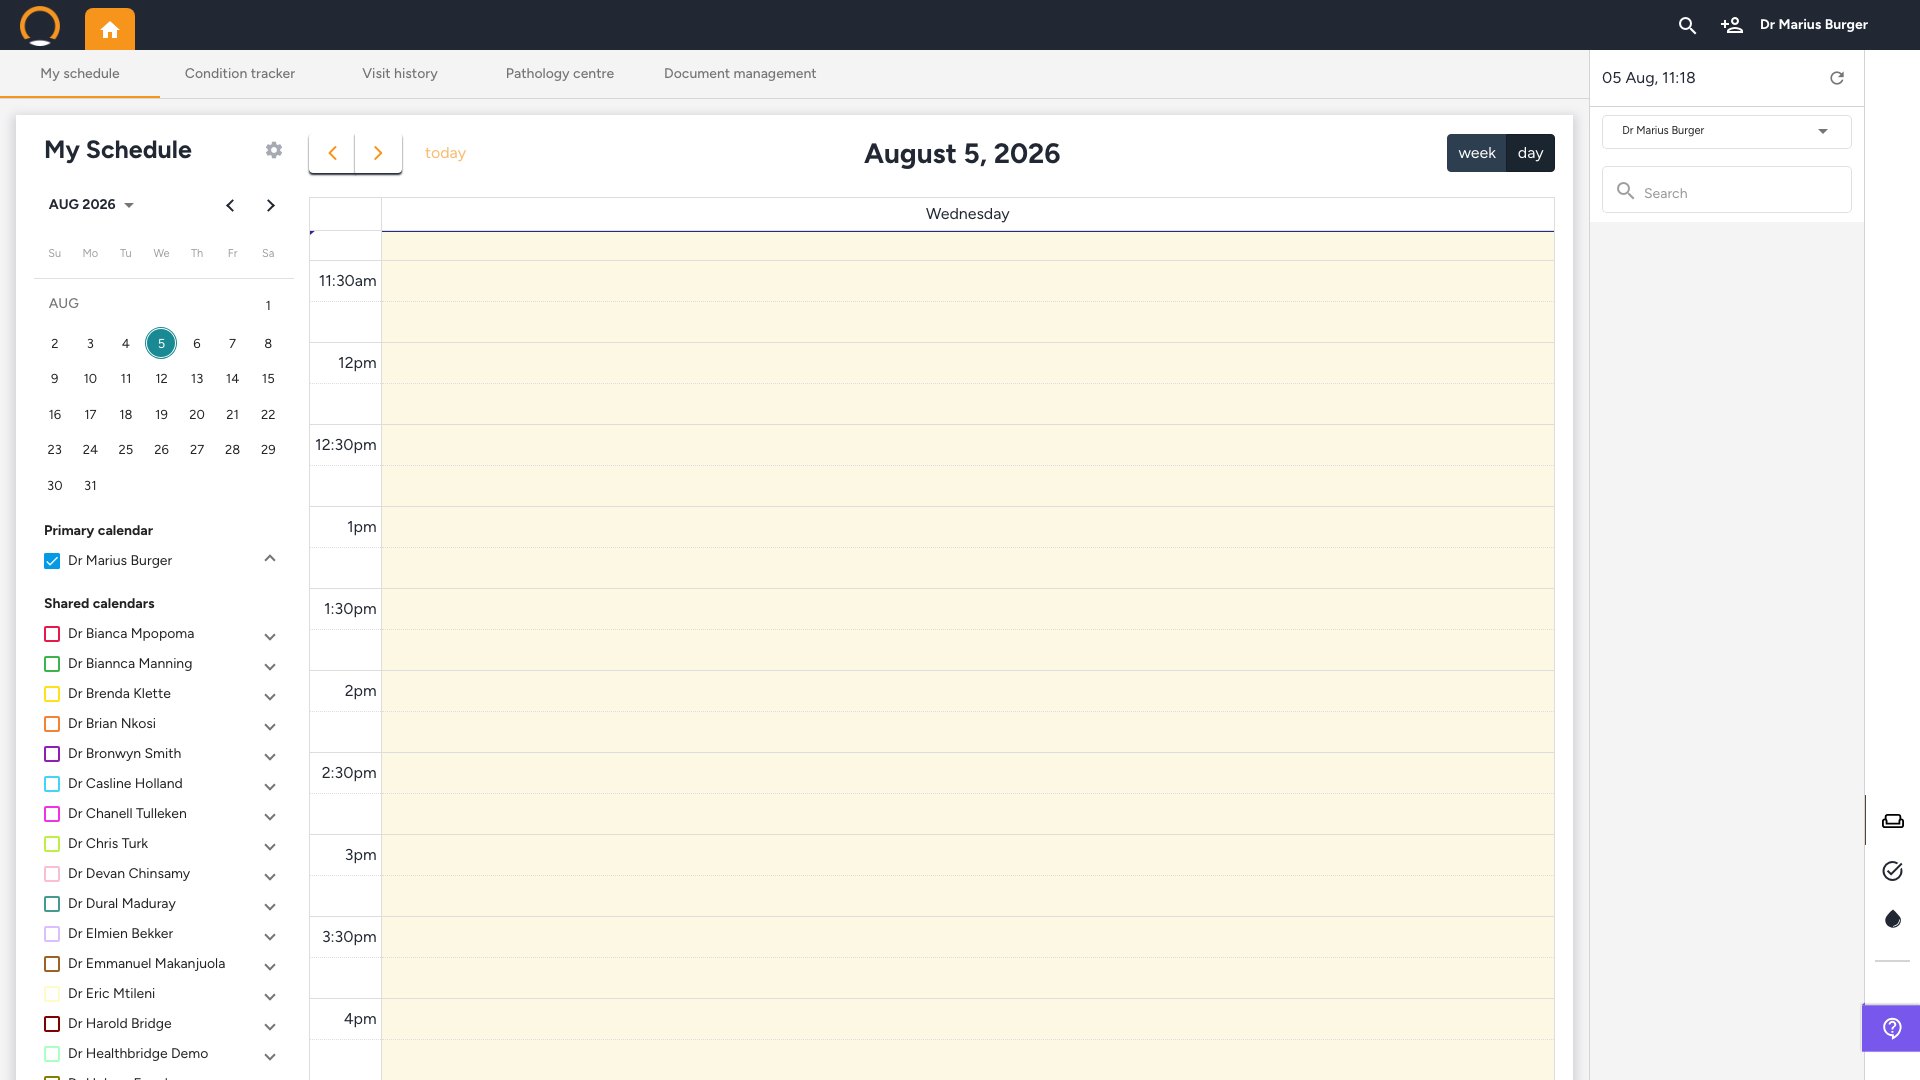
Click the Waiting Room icon in the right-hand strip to see everyone currently checked in or mid-consultation, grouped by status (for example 'In Progress'). The badge number on the icon shows how many patients are waiting.
4. Pathology
Location: Right-hand icon strip
Click the Pathology icon (droplet) to see recently received lab results. Click 'View all path results' to open the full Pathology Centre. The badge number shows how many new results have arrived.
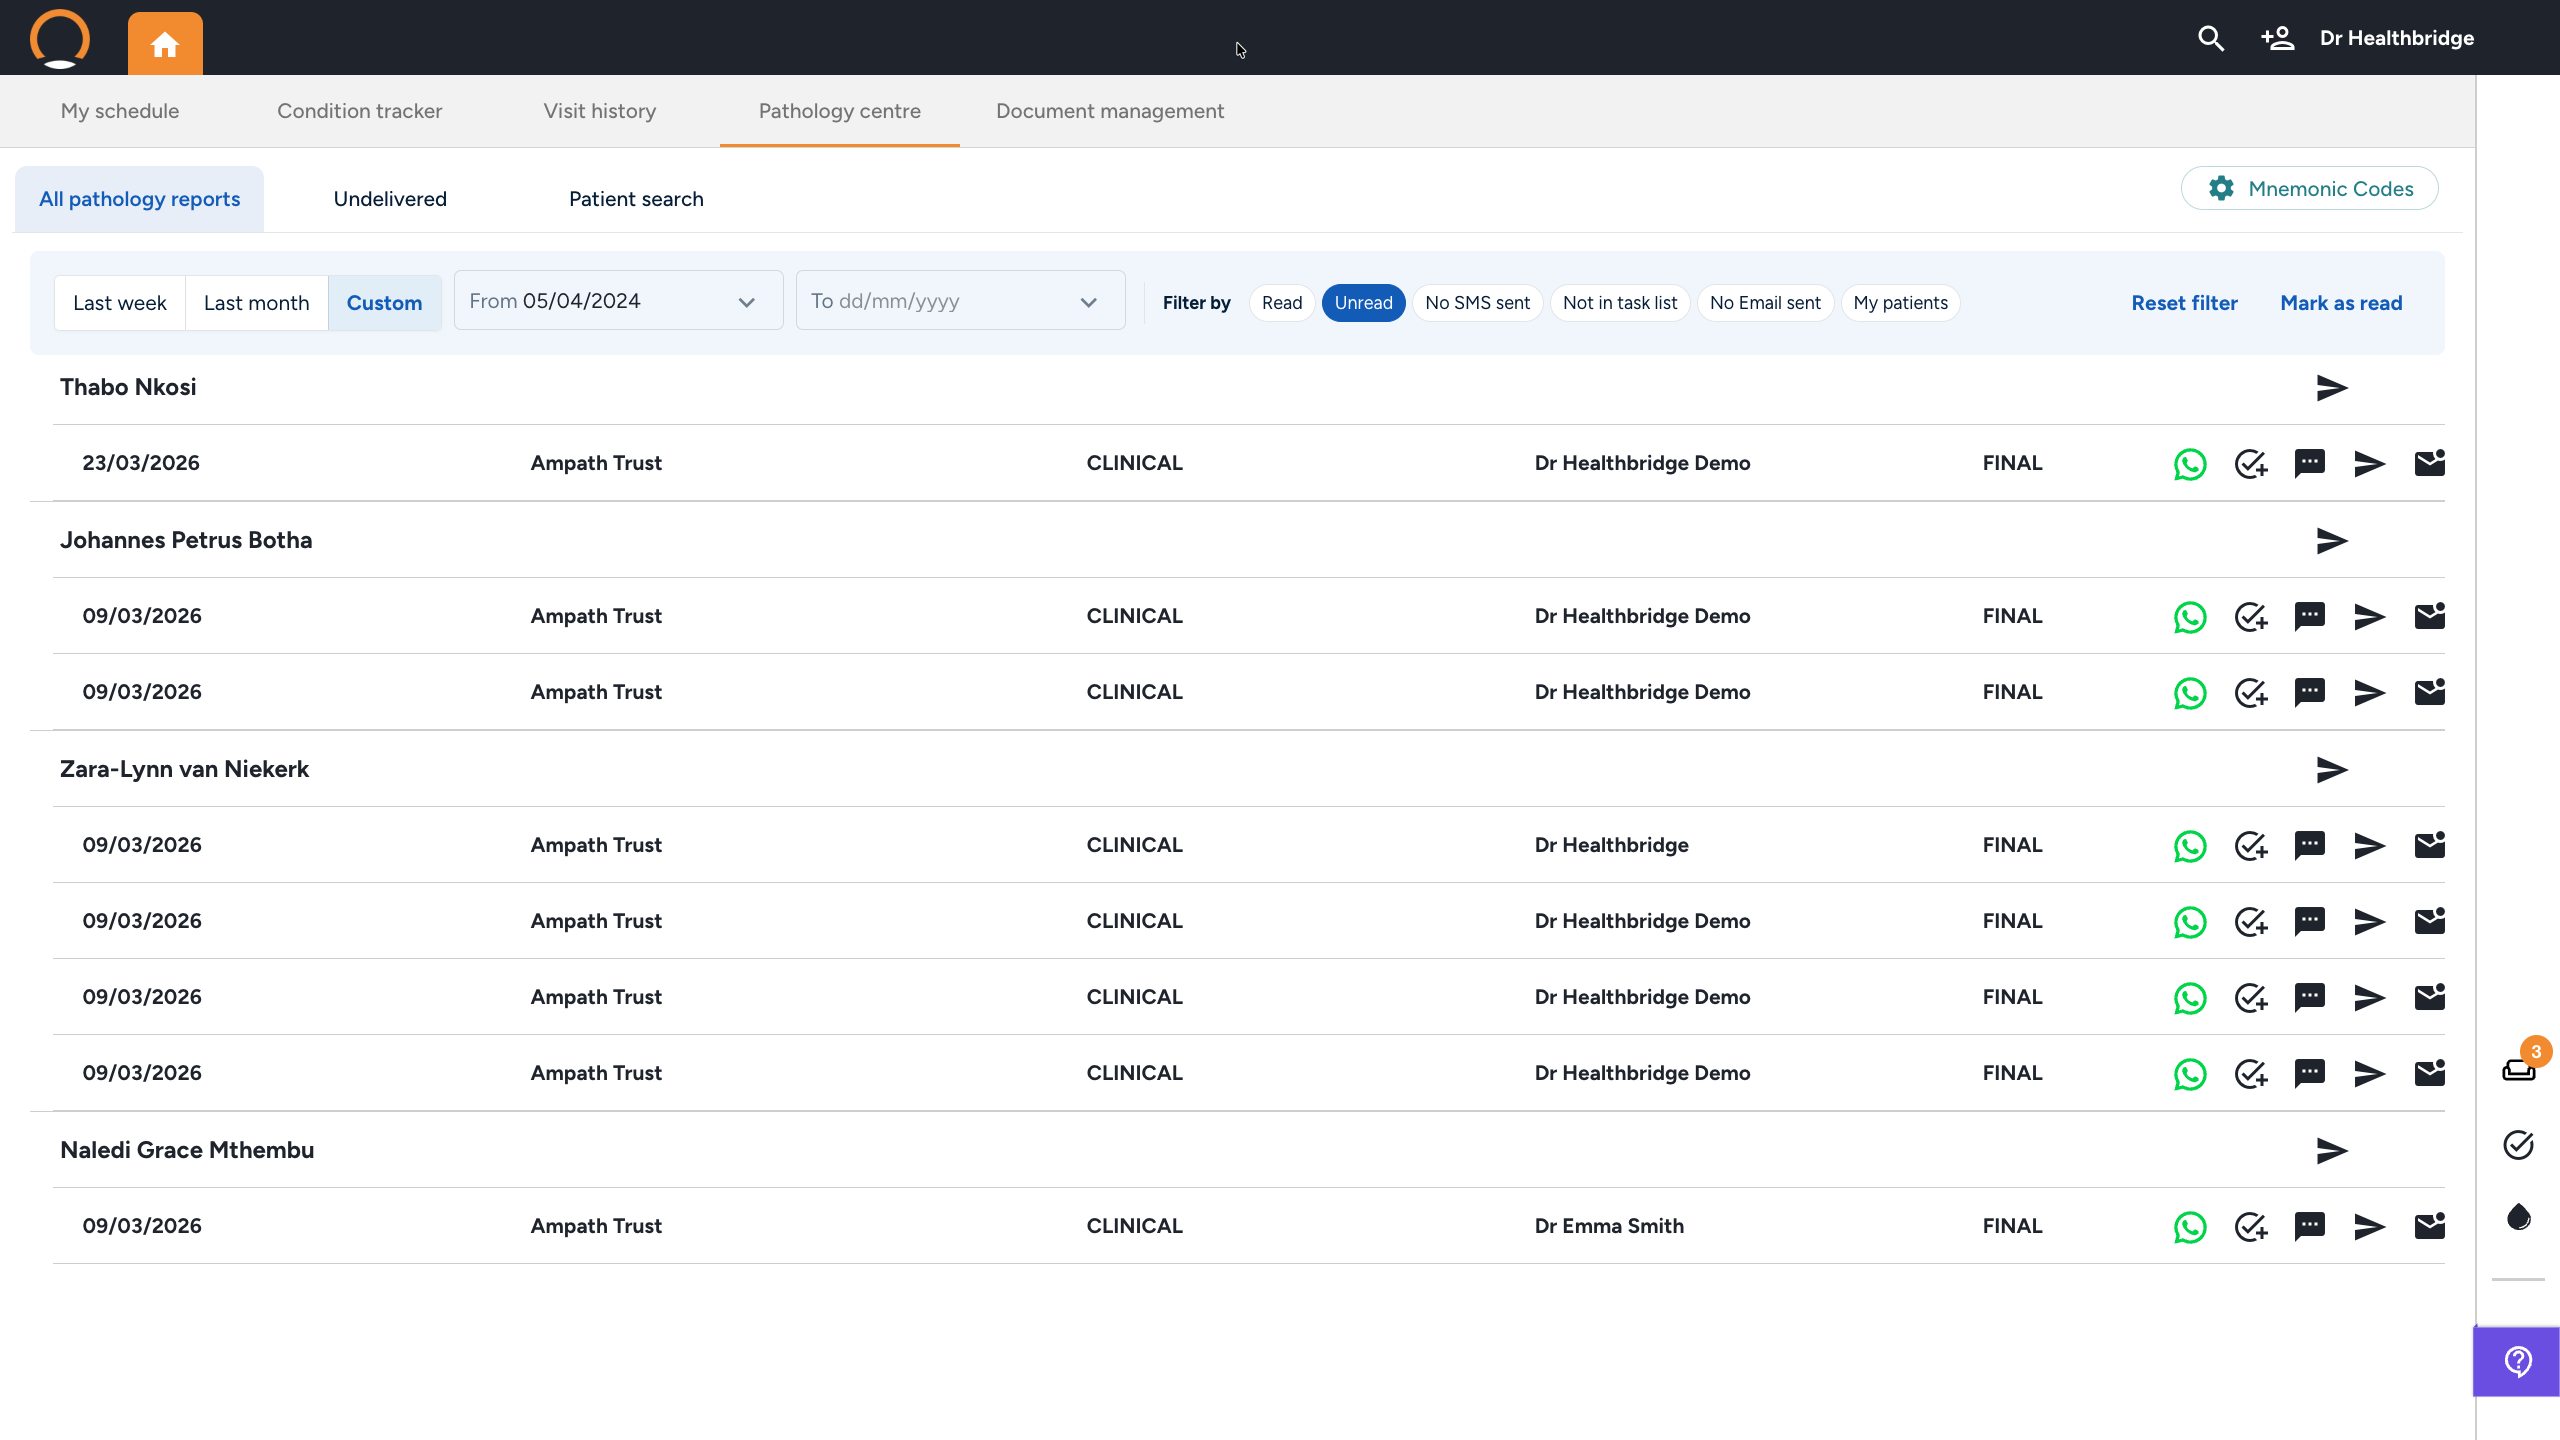
Go deeper: See Pathology Centre for filtering results, sending AI WhatsApp notifications via the Pathology Messenger, and configuring lab mnemonic codes.
5. Provider name and settings
Location: Top-right corner
Your name in the top-right corner shows which provider you're logged in as. Click it to open the Provider File, with a left menu for Provider details, Custom Visit Templates, Letters & SMS's, Pathology, Address Book, Stylus Templates, Settings, Support, and Change password.
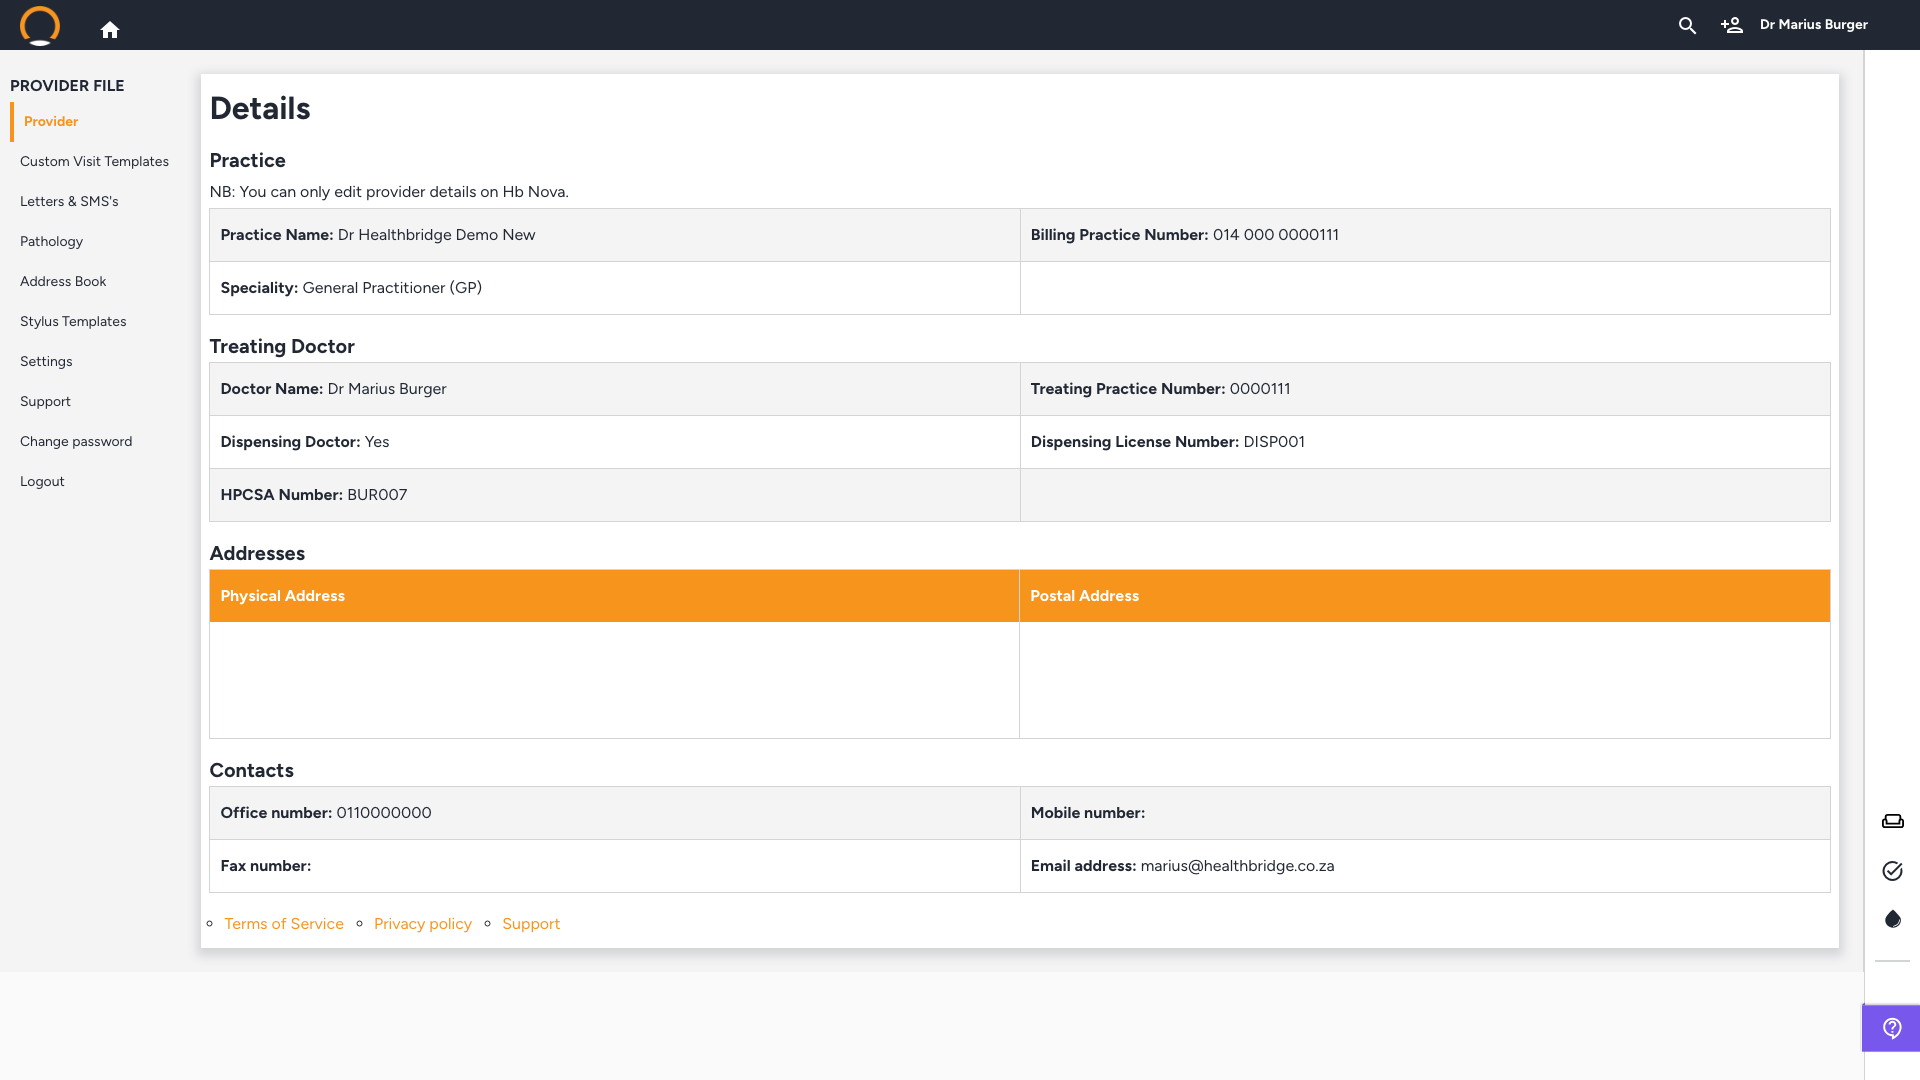
Go deeper: Practice and Provider Settings covers the Settings page in full. Custom Visit Templates, Customizing Letters and SMS, and Address Book each cover their own left-menu item.
6. Inside a consultation
Location: Right-hand icon strip, inside an open consultation
Once you're inside a consultation, the right-hand strip adds icons for the patient's executive summary card (a compact view of their conditions, medications, and allergies), the Clinical Assistant (Lightbulb icon), Nora speech-to-notes (Microphone icon), and a More options menu, alongside the same Waiting Room, Tasks, and Pathology icons from the landing page.
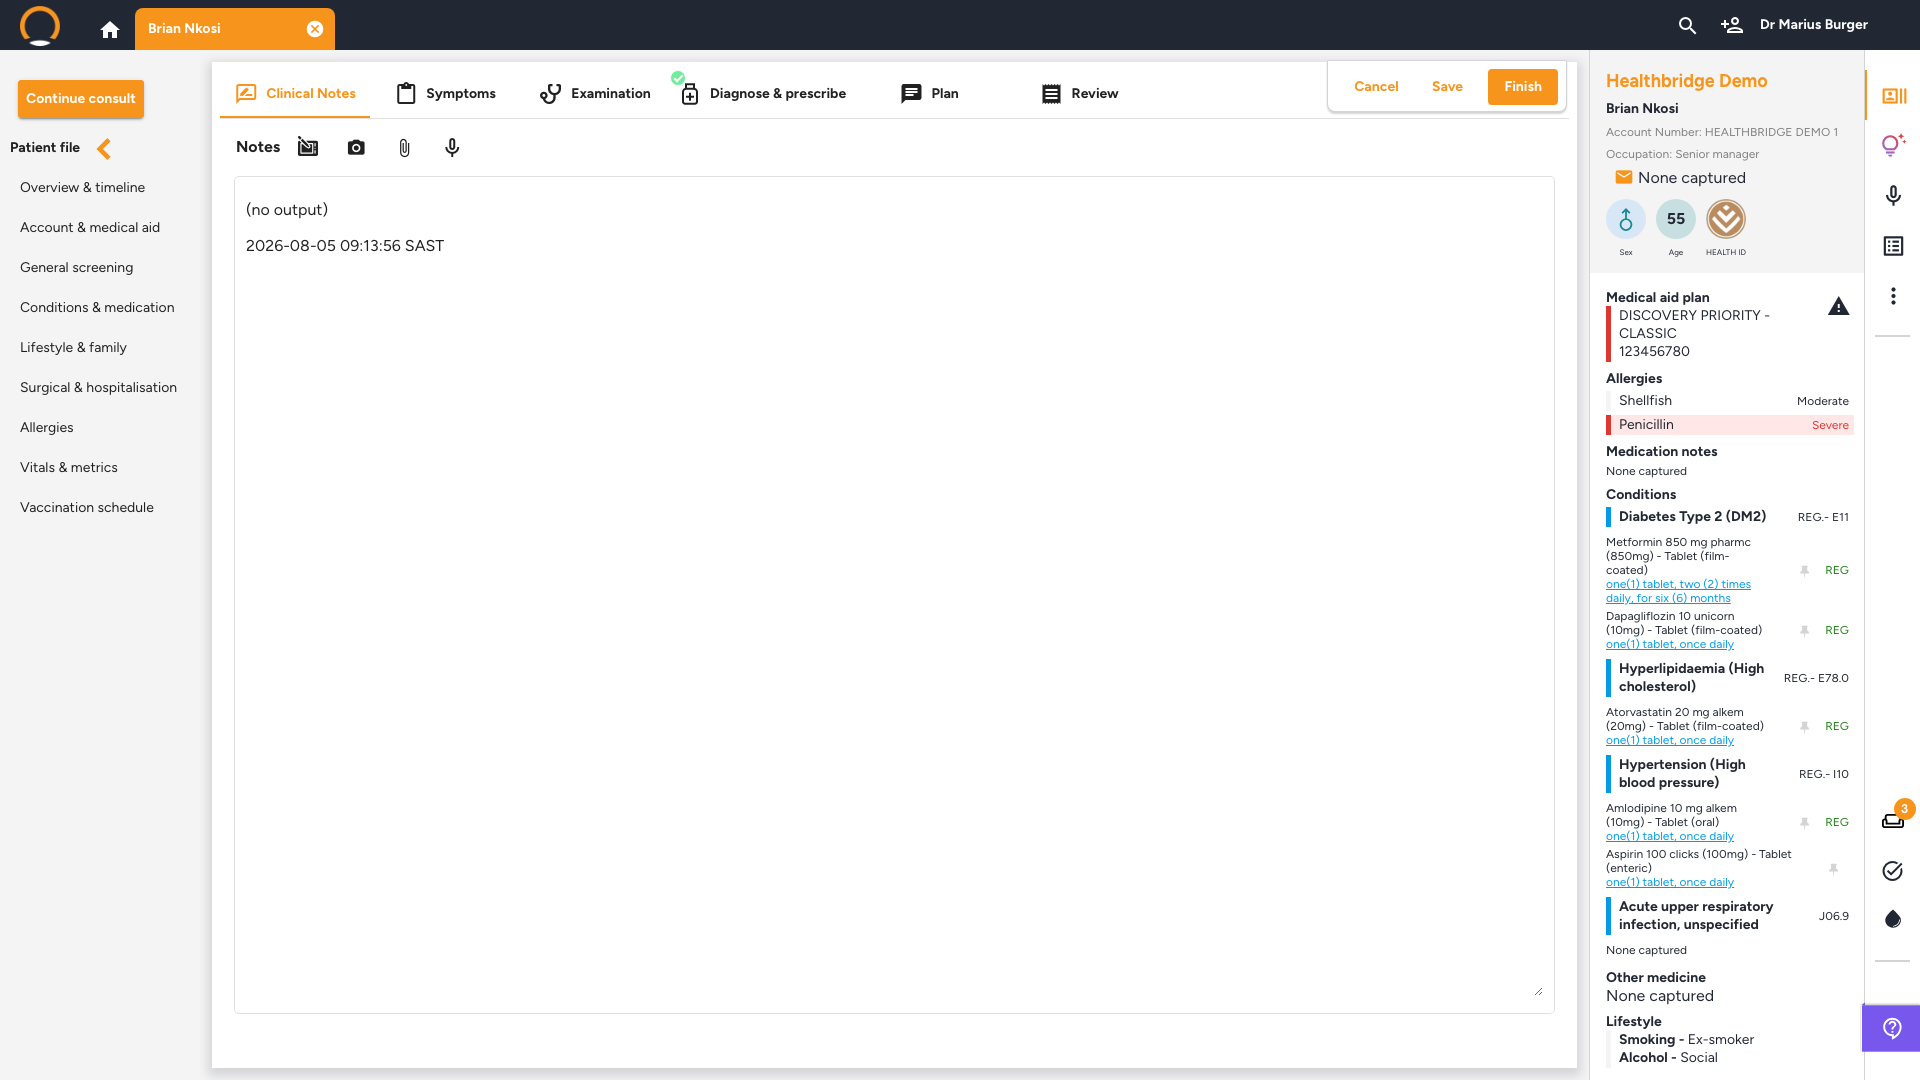
Go deeper: See Conducting a Consultation for the full consultation flow, Nora, Speech to Clinical Notes for the microphone icon, and Clinical Insights for the Lightbulb icon's AI Q&A tool.