Healthbridge Clinical Reports
Healthbridge Clinical give you access to data-driven Business Insight reports on how your practice is performing.
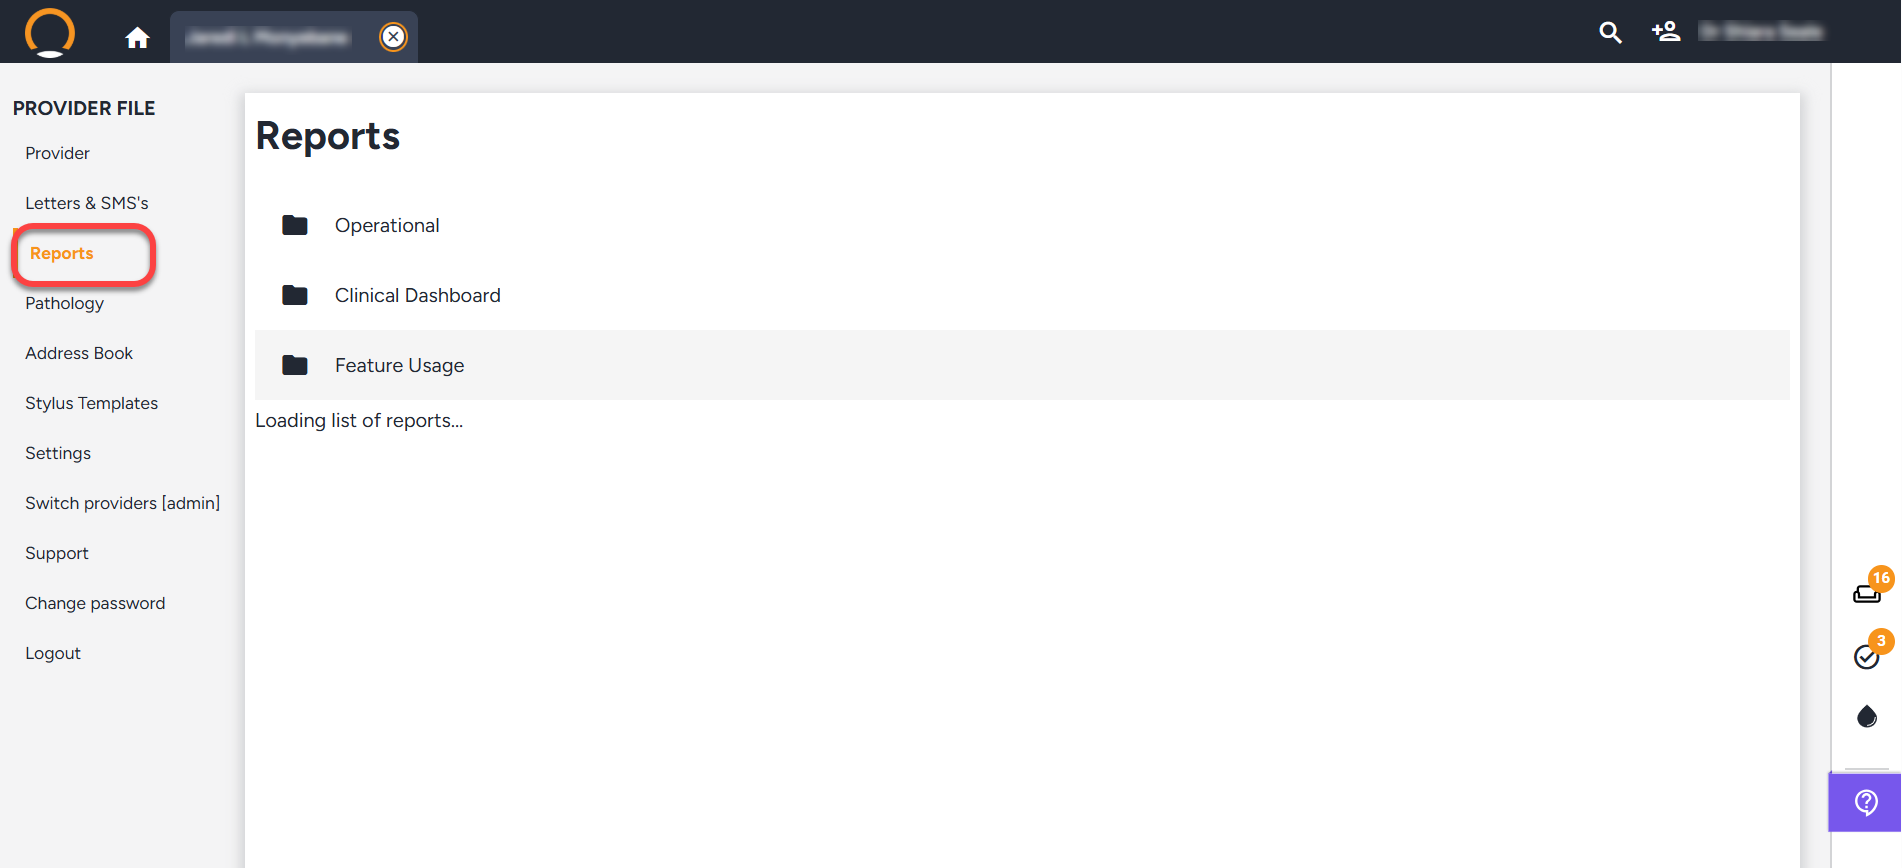
To access your Business Insight reports, click on the ‘ Reports ’ icon(found under the Practice and Provider settings menu).
The ‘Clinical dashboard ’, ‘ Feature Usage ’ and ‘Operational ’ reports display different information and graphs to help you better manage and grow your practice.
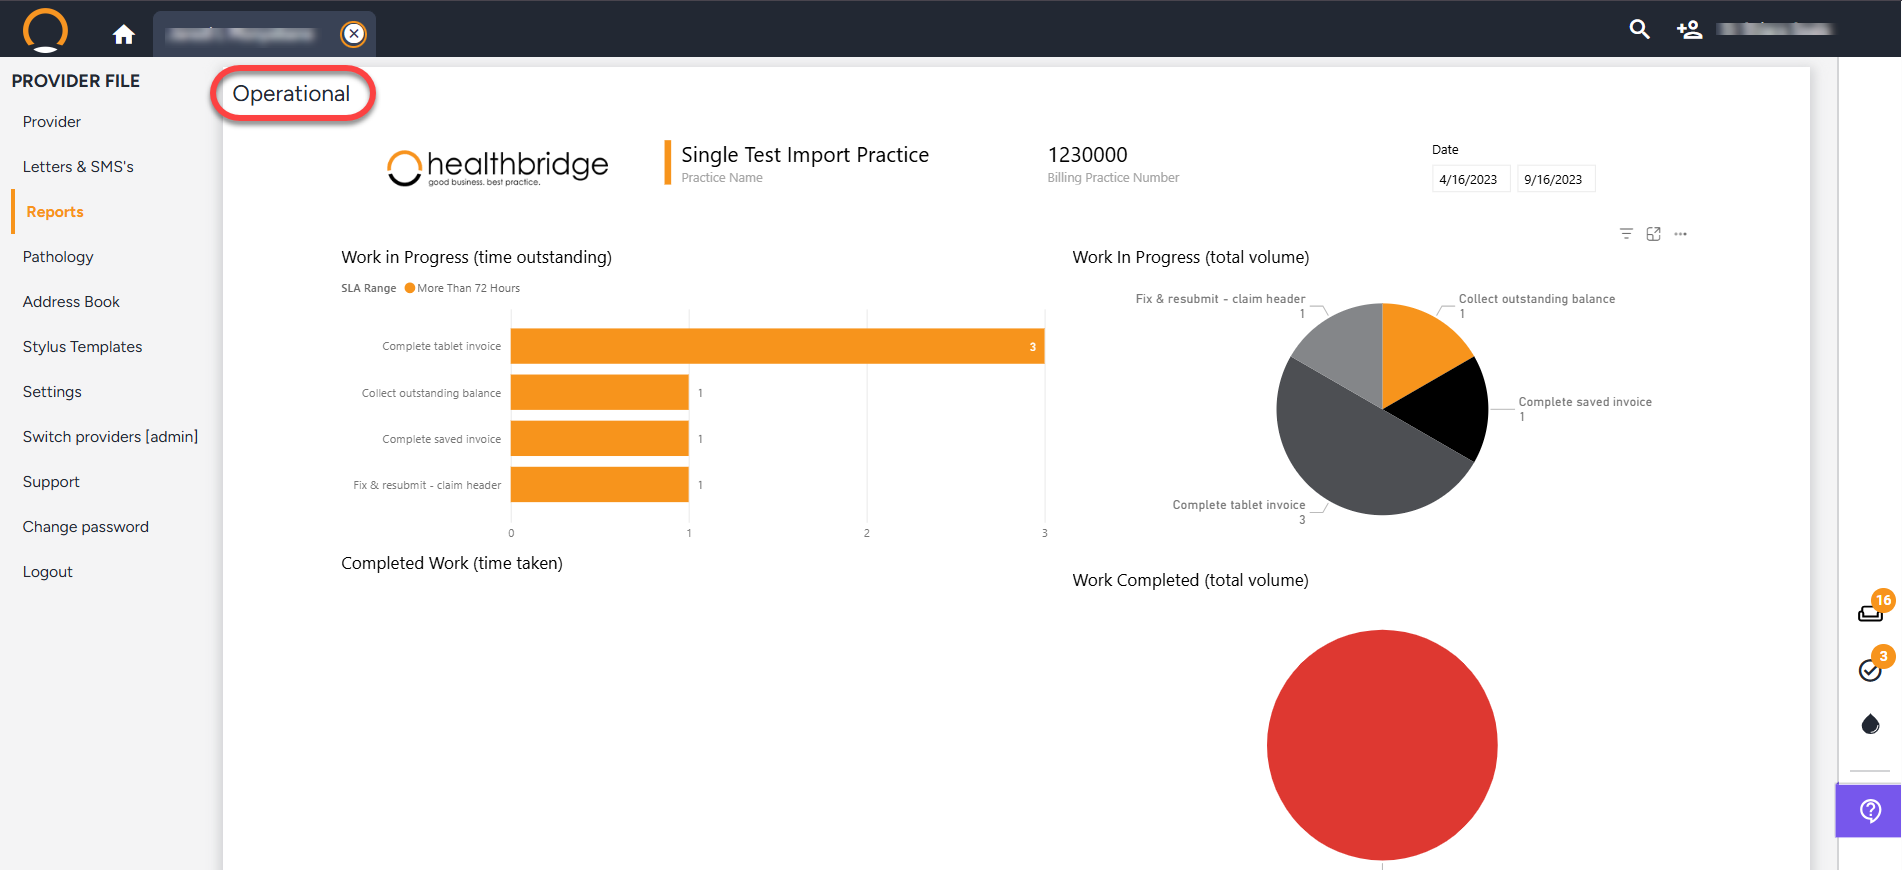
Operational
The data for this report is pulled from myMPS Inbox and put into the following Four categories.

- Work in Progress (time outstanding) Lists all items that are incomplete and the amount of time they have been outstanding for the selected period.
- Work in Progress (total volume) Gives you the total amount for the selected items that are outstanding.
- Completed Work (time taken) This graph lists all the completed work items and the time it took to complete them.
- Work Completed (total volume) This chart lists the total number of all completed items
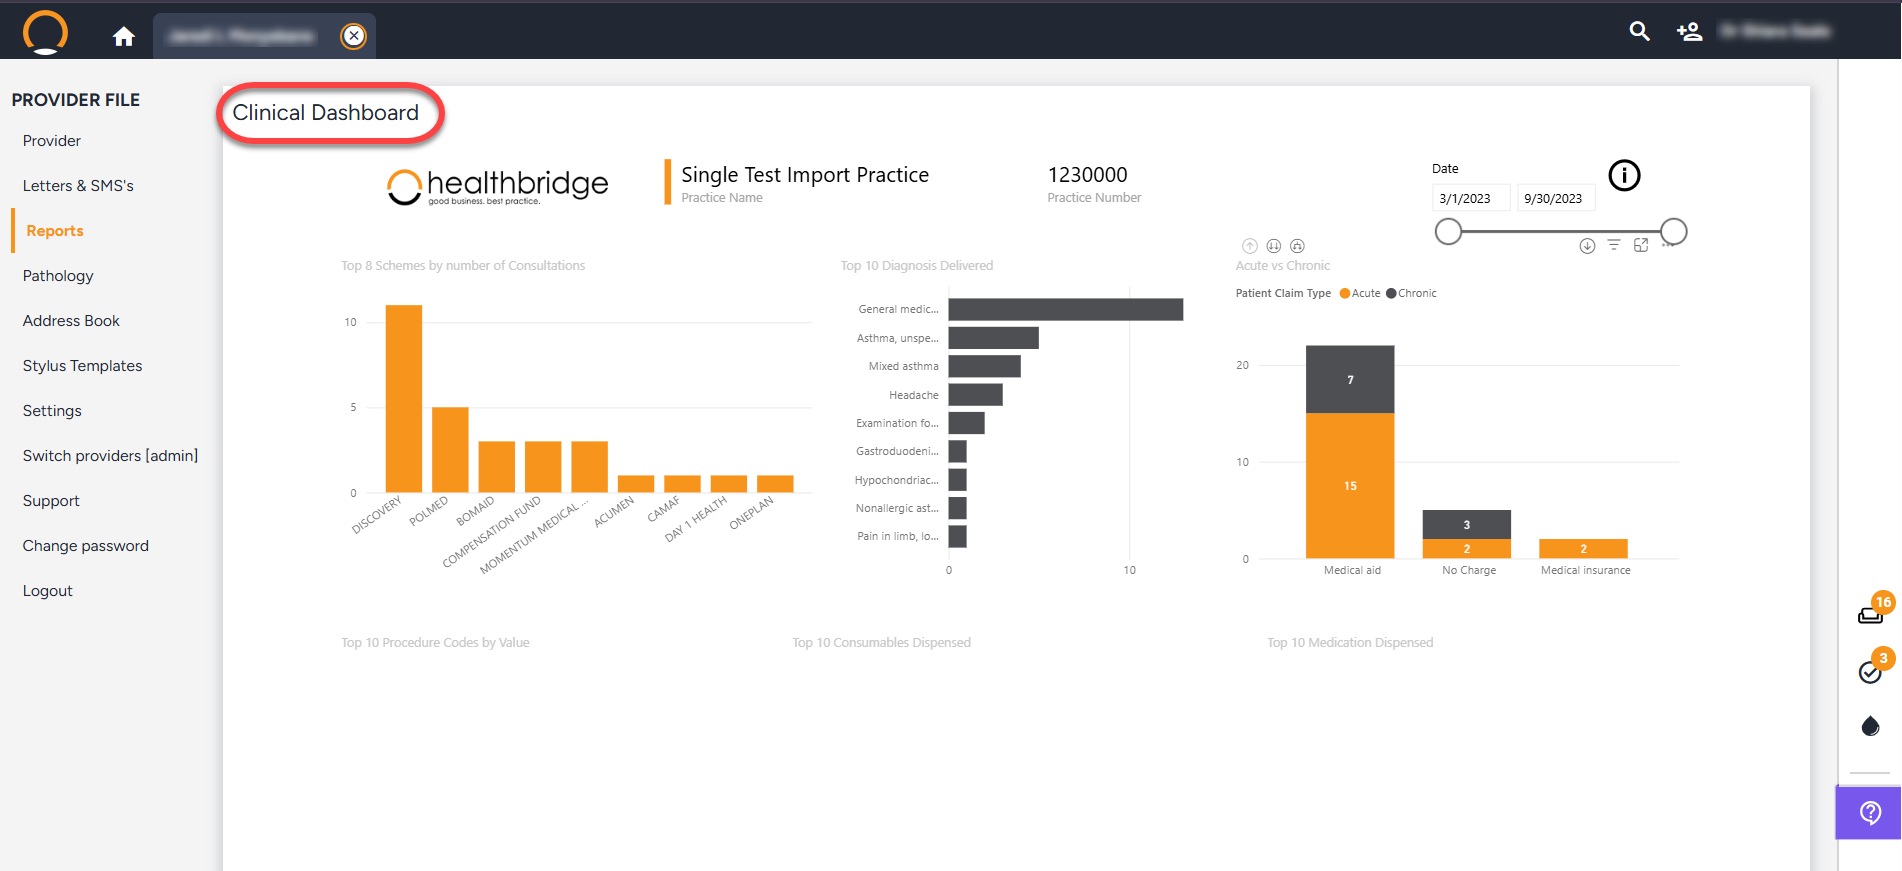
Clinical Dashboard
This report lists your interactions with the 'HealthBridge Clinical product.

- Top 8 Schemes -This graph lists your top 8 schemes by the number of consultations. By clicking on each scheme, the data on the rest of the graphs will reflect stats for that selected scheme.
- Top 10 diagnoses -This graph indicates your top 10 most frequently used diagnoses.
- Top Acute vs. chronic claim types - This graph lists the number of claim types (Acute vs Chronic) for each of these categories medical aid,no charge,medical insurance
- Top 10 Procedure Codes - This is a list of your top 10 procedure codes by value. Hover your mouse over each item in order to view more details.
- Top 10 Consumables Dispensed - This chart lists the number of consumables dispensed, including the Nappi descriptions and measurements.
- Top 10 Medications dispensed - If you’re a dispensing doctor, this graph will list your top 10 medications dispensed and the value of each medication.
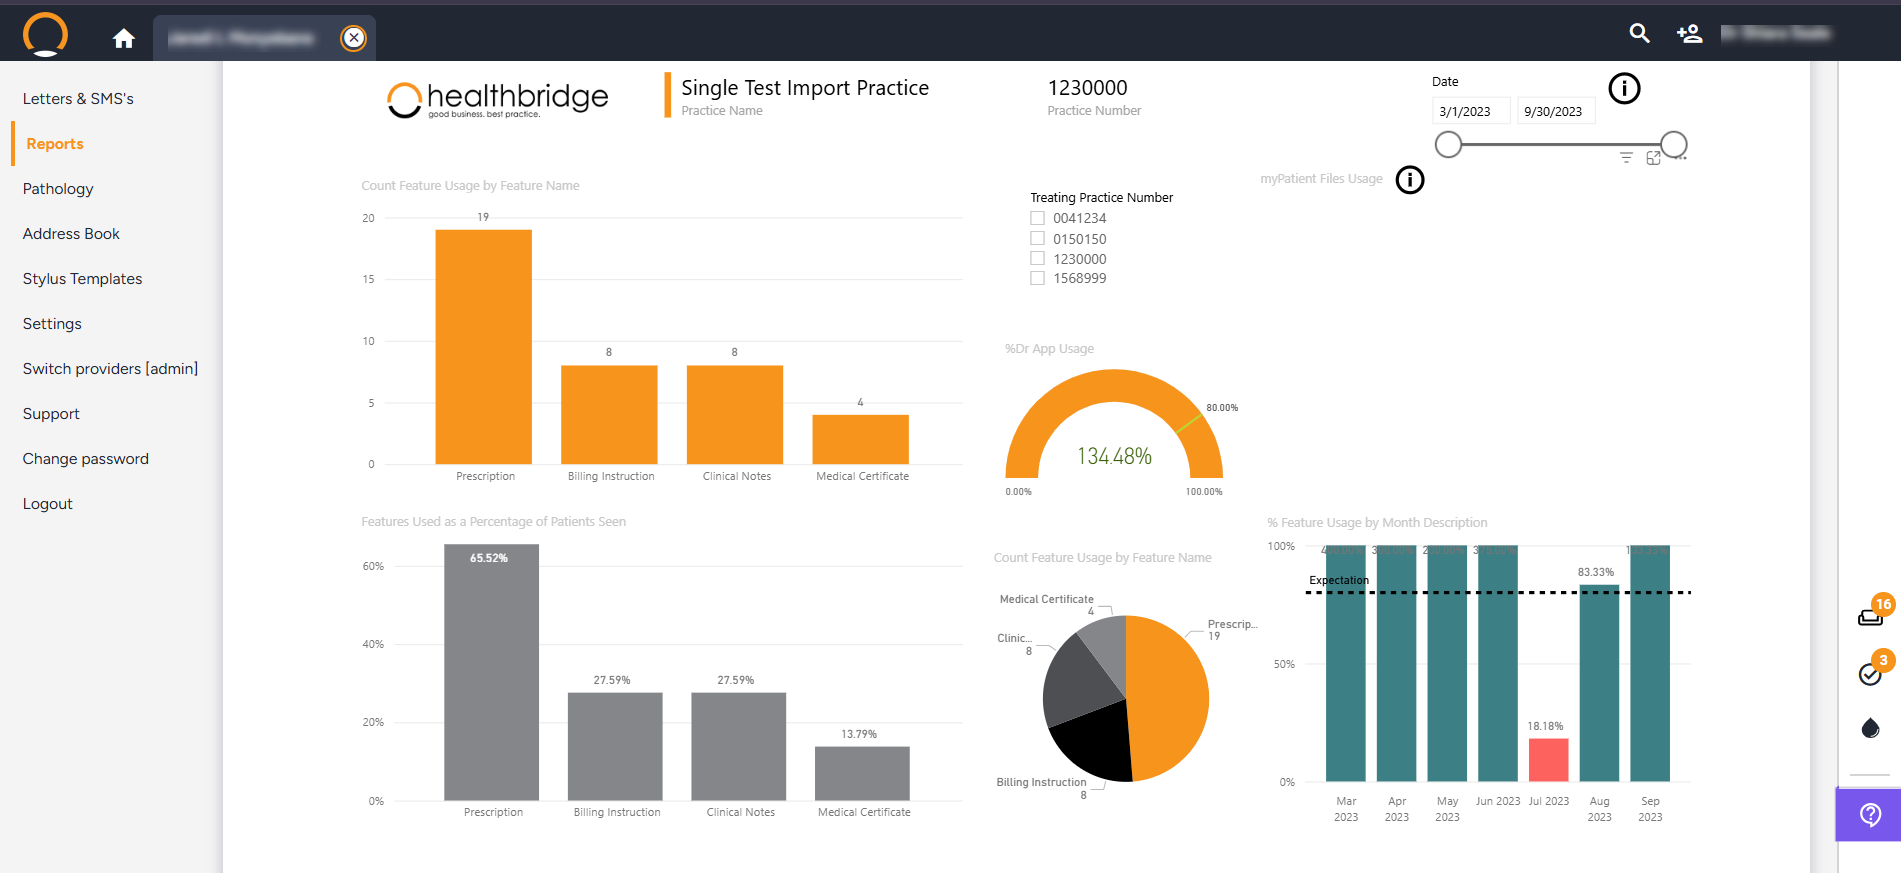
Feature Usage
Shows the doctor’s usage of the 'HealthBridge clinical' product
- Count feature usage by feature name - Informs you of how much you use each feature of the product.
- Features Used as a Percentage of Patients Seen - This graph gives you a percentage of how each feature is used per patient seen.
- CountFeature Usage by Feature Name - This chart will give you a percentage of how each feature is used.
- Percentage of Dr App Usage - This shows your usage holistically as a percentage and whether you’re reaching your target.
- Percentage Feature Usage by Month Description - These graphs show your usage on a month-to-month basis and whether you have achieved the expectations.
- myPatientFiles usage This shows your usage of myPatientFiles listing each feature. (If you are not making use of myPatientFiles then this space will display an ‘ i ’. Tapping on the ‘ i ’ will inform you how to enable this service.)